Change in alliance scenario in 2019:
BJP won 282 LS seats in 2014 Parliament Election
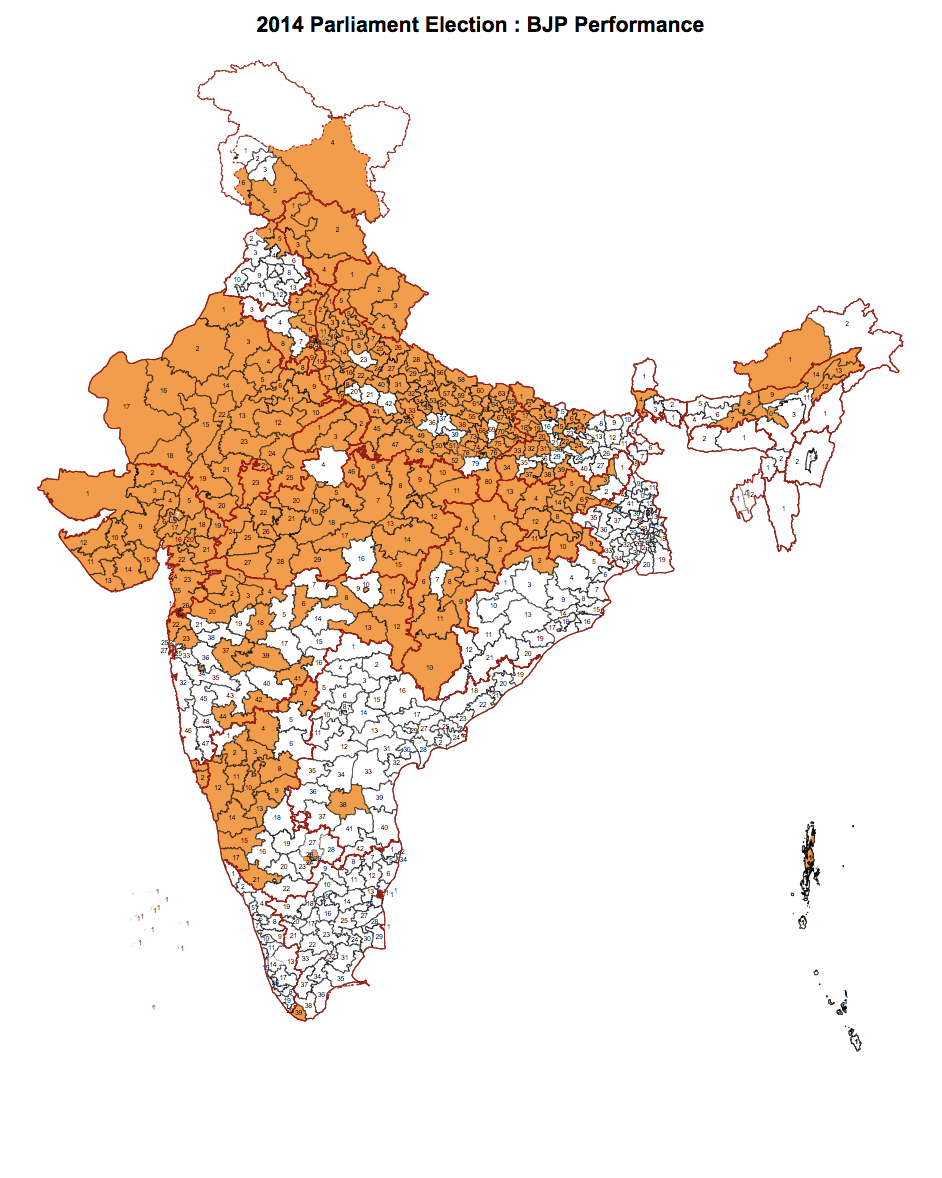
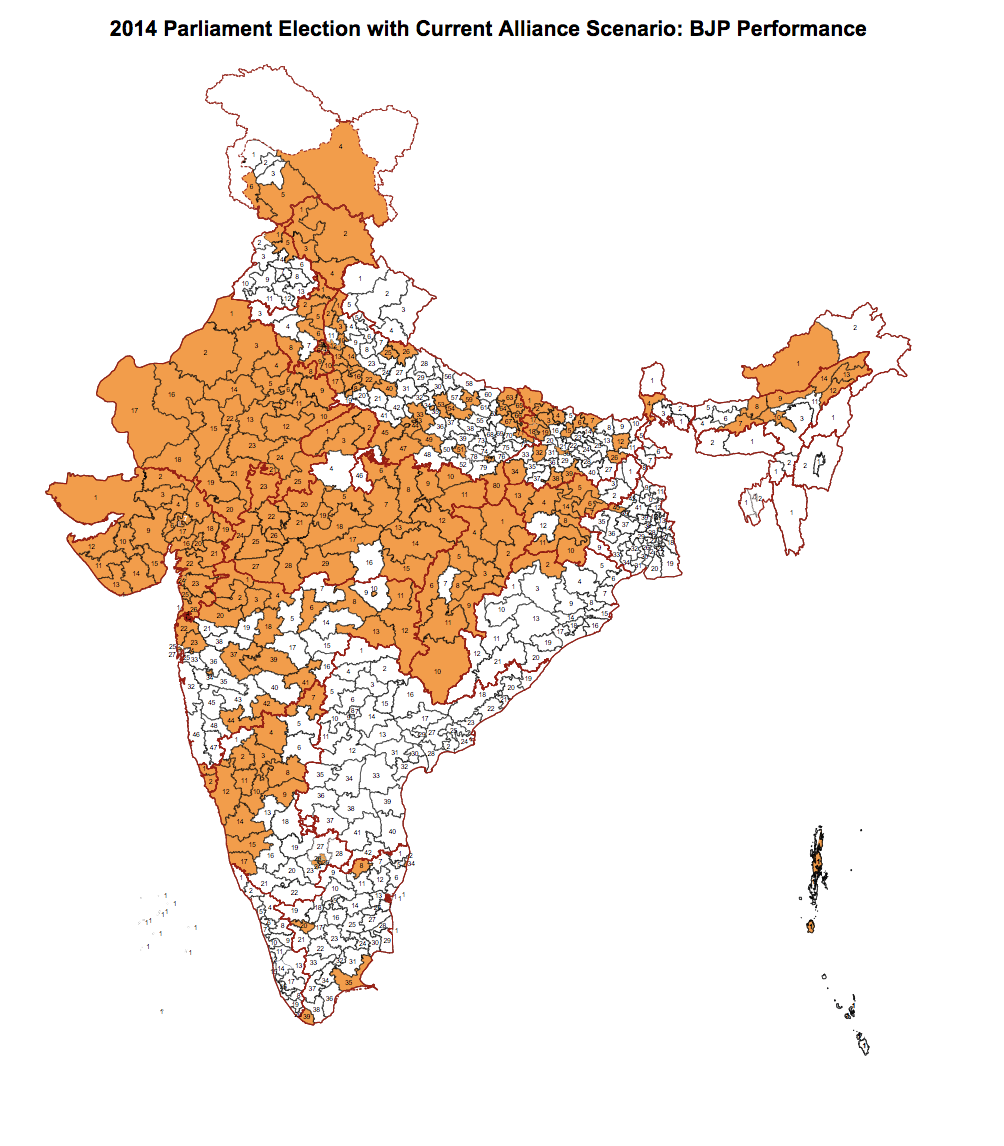
At present the alliance scenario has changed in 2019. The major changes in alliance scenario between 2014 and 2019 is described below:
Now in the new alliance scenario, if BJP polled the same like 2014 and opposition polled the same like 2014, BJP will be winning 227 LS seats.
Now let us analyse where we should give corrections. We assume that BJP will poll the same vote% of 43% in UttarPradesh in 2019 as it polled in 2014.
BJP is expected to improve its vote share in the following States as compared to 2014:
At the same time BJP is expected to lose its vote share in the rest of Indian States.
Expected Gains from West Bengal for BJP:
It is expected that BJP will replace left as the main opposition of TMC. It can be concluded very easily that BJP will improve its vote share. One point to be noted, 28% of Bengal population is Muslim. The rise of BJP will ensure a good consolidation (around 70%) of Muslim votes in favour of TMC.
It means BJP will have to consolidate Hindu votes in West Bengal. I believe the best Hindu consolidation of Hindu votes in favour of BJP occurred in UttarPradesh 2014 Parliament Elections. In Uttar Pradesh 2014 Parliament Election, BJP was able to get around 43% vote out of 79% hindu population. So around 54.4% of hindu voters in Uttar Pradesh voted for BJP in 2014 Parliament election. In Bengal the maximum Hindu consolidation can happen in the level of 45% in favour of BJP. So BJP will end up with around 32% vote. Still TMC will manage with 40% vote. So the maximum tally of BJP can go up to 10 LS seats from West Bengal.
Expected gains from Odisha for BJP :
Please note there is simultaneously MLA and MP elections in Odisha. It can be safely assume that Mr. Navin Patnaik will once again gain the complete majority and form the State Government. Now the question is how many voters did a split voting in 2019 Odisha election. The main deciding factor in the Parliament election will be how many of them voted for Congress or BJD in assembly election but voted for BJP in the Parliament election.
To vote differently in assembly and Parliament, a voter has to be educated enough. Odisha has around 22% Tribal Population. Odisha also has around 17% SC population. In the Past, Odisha has not shown a huge split voting among the 3 major parties (BJD, BJP and Congress).
So as per my understanding BJP can win at the maximum 10 LS seats from Odisha in 2019 Parliament election.
Expected gains from Tripura for BJP :
BJP is expected to gain two LS seats from Tripura.
Expected gains from Karnataka, Kerala and Haryana for BJP :
BJP won 17/28 LS seats from Karnataka in 2014.
BJP won 7/10 LS seats from Haryana in 2014.
So there cannot significant gains from BJP from Haryana and Karnataka.
BJP can gain a LS seat from Kerala.
|
State |
Maximum LS seats Possible for BJP in 2019 |
|
West Bengal |
10 |
|
Odisha |
10 |
|
Tripura |
2 |
|
Haryana |
7 |
|
Karnataka |
17 |
|
Kerala |
1 |
|
Total LS seats for BJP |
47 |
In 2014 Parliament election, BJP won 27 LS seats from these 6 States. So there can be a maximum gain of 20 LS seats for BJP in 2019 as compared to 2014 from these 6 States.
Expected loss for BJP outside UP and Bihar for BJP :
Please note BJP performed its worst (last 15 years) in terms of assembly seat tally in the recently concluded Gujarat, Madhya Pradesh, Chattisgarh, Punjab and Rajasthan assembly elections.
Also BJP will face double anti-incumbency in
From these 12 States BJP is expected to lose at least 35 LS seats in 2019 Parliament Election due to loss in vote%. It is mainly due to the loss of SC+ST votes as compared to 2014 for BJP. We also analysed why do we feel BJP will lose SC and ST votes in 2019 as compared to 2014.
We also don’t expect BJP to win all 17 LS seats as it is contesting from Bihar. We believe BJP can win maximum 15 LS seats from Bihar.
Final tally of BJP in 2019:
|
Parameter |
LS Seats won |
|
After adjusting the alliance Scenario |
227 |
|
Gain from WestBengal,Odisha,Tripura,Haryana,Kerala,Karnataka |
+20 |
|
Loss from 12 States |
-35 |
|
Loss from Bihar |
-2 |
|
Final Tally of BJP |
210 |
Will BJP lose support from SC ad ST segments as compared to 2014?
We analysed the data of recently concluded Chattisgarh, MadhyaPradesh and Rajasthan election results. We compared the assembly election 2018 results with 2014 Parliament and 2013 assembly election results.
Methodology used to analyse it:
Recent Voting Pattern in SC dominated districts of Chattisgarh,Madhya Pradesh and Rajasthan :
|
Districts with more than 20% SC population |
State |
% SC Population |
% ST Population |
% Muslim Population |
Vote% of BJP in respective districts |
||
|
2013 Assembly |
2014 Parliament |
2018 Assembly |
|||||
|
Bilaspur |
Chhattisgarh |
20.8% |
18.7% |
2.2% |
37.8% |
49.9% |
33.7% |
|
Janjgir-Champa |
Chhattisgarh |
24.6% |
11.6% |
0.9% |
34.2% |
48.0% |
30.6% |
|
Baloda Bazar |
Chhattisgarh |
22.1% |
15.1% |
0.8% |
41.5% |
50.1% |
27.6% |
|
Mungeli |
Chhattisgarh |
29.2% |
10.1% |
0.8% |
40.7% |
51.3% |
34.1% |
|
Average of Chattisgarh |
24.1% |
13.9% |
1.2% |
38.5% |
49.8% |
31.5% |
|
|
Ashok Nagar |
Madhya Pradesh |
20.8% |
9.7% |
4.8% |
37.9% |
36.1% |
36.8% |
|
Bhind |
Madhya Pradesh |
22.0% |
0.4% |
3.9% |
33.5% |
57.7% |
30.1% |
|
Chhatarpur |
Madhya Pradesh |
23.0% |
4.2% |
4.0% |
38.8% |
55.0% |
30.7% |
|
Datia |
Madhya Pradesh |
25.5% |
1.9% |
3.6% |
36.6% |
51.4% |
35.4% |
|
Morena |
Madhya Pradesh |
21.4% |
0.9% |
3.9% |
35.4% |
44.2% |
29.6% |
|
Panna |
Madhya Pradesh |
20.5% |
16.8% |
3.5% |
36.6% |
48.2% |
38.9% |
|
Sagar |
Madhya Pradesh |
21.1% |
9.3% |
4.4% |
48.6% |
56.1% |
47.0% |
|
Sehore |
Madhya Pradesh |
20.7% |
11.1% |
10.5% |
51.8% |
65.5% |
48.9% |
|
Shajapur |
Madhya Pradesh |
23.4% |
2.5% |
11.6% |
48.7% |
57.2% |
37.4% |
|
Tikamgarh |
Madhya Pradesh |
25.0% |
4.7% |
3.1% |
41.4% |
54.0% |
34.6% |
|
Ujjain |
Madhya Pradesh |
26.4% |
2.5% |
11.7% |
52.0% |
63.8% |
47.0% |
|
Vidisha |
Madhya Pradesh |
20.0% |
4.6% |
10.3% |
46.0% |
58.5% |
49.5% |
|
Average of MadhyaPradesh |
22.5% |
5.7% |
6.3% |
42.3% |
54.0% |
38.8% |
|
|
Nagaur |
Rajasthan |
21.2% |
0.3% |
13.7% |
46.8% |
45.8% |
32.4% |
|
Bikaner |
Rajasthan |
20.9% |
0.3% |
10.0% |
40.1% |
63.4% |
40.0% |
|
Churu |
Rajasthan |
22.1% |
0.6% |
12.2% |
47.0% |
49.6% |
33.9% |
|
Bharatpur |
Rajasthan |
21.9% |
2.1% |
14.6% |
37.7% |
60.1% |
32.8% |
|
Ganganagar |
Rajasthan |
36.6% |
0.7% |
2.6% |
32.4% |
53.3% |
32.3% |
|
Kota |
Rajasthan |
20.8% |
9.4% |
12.5% |
52.2% |
56.8% |
47.5% |
|
Hanumangarh |
Rajasthan |
27.8% |
0.8% |
6.7% |
39.6% |
55.8% |
41.7% |
|
Dausa |
Rajasthan |
21.7% |
26.5% |
2.8% |
34.1% |
29.2% |
34.5% |
|
Karauli |
Rajasthan |
24.3% |
22.3% |
5.6% |
29.7% |
39.8% |
32.0% |
|
Tonk |
Rajasthan |
20.3% |
12.5% |
10.8% |
47.7% |
57.5% |
39.9% |
|
Sawai Madhopur |
Rajasthan |
20.9% |
21.4% |
11.7% |
38.3% |
47.0% |
31.4% |
|
Dholpur |
Rajasthan |
20.4% |
4.9% |
6.0% |
31.0% |
56.0% |
38.0% |
|
Average of Rajasthan |
23.2% |
8.5% |
9.1% |
39.7% |
51.2% |
36.4% |
|
|
Average of Rajasthan, MadhyaPradesh and Chattisgarh |
23.3% |
9.4% |
5.5% |
40.2% |
51.7% |
35.6% |
|
So in these SC dominated districts (average SC population 23.3%) of these 3 States, the vote% of BJP reduced to 35.6% in 2018 assembly election as compared to 40.2% in 2013 assembly elections. So there is a drop of 4.6% in between two assembly elections.
When it is compared with 2014 Parliament election then the drop is 16.1%.
This indicates SC votes are drifting away from BJP as compared to 2013 Assembly or 2014 Parliament election.
Recent Voting Pattern in ST dominated districts of Chattisgarh,Madhya Pradesh & Rajasthan :
|
Districts with more than 25% ST population |
State |
% SC Population |
% ST Population |
% Muslim Population |
Vote% of BJP in respective districts |
||
|
2013 Assembly |
2014 Parliament |
2018 Assembly |
|||||
|
Balrampur |
Chattisgarh |
4.5% |
59.2% |
4.4% |
38.5% |
49.1% |
27.7% |
|
Kanker |
Chattisgarh |
4.2% |
55.4% |
0.8% |
39.2% |
50.6% |
34.5% |
|
Bijapur |
Chattisgarh |
4.0% |
80.0% |
0.6% |
41.8% |
53.3% |
28.5% |
|
Bastar-Jagdalpur |
Chattisgarh |
2.7% |
65.9% |
0.9% |
38.9% |
52.9% |
33.2% |
|
Jashpur |
Chattisgarh |
5.7% |
62.3% |
1.8% |
49.7% |
57.5% |
38.3% |
|
Dantewada |
Chattisgarh |
2.4% |
76.9% |
1.2% |
32.7% |
54.3% |
33.4% |
|
Narayanpur |
Chattisgarh |
3.6% |
77.4% |
0.6% |
48.8% |
59.9% |
42.3% |
|
Kondagaon |
Chattisgarh |
4.7% |
66.9% |
1.3% |
35.3% |
45.9% |
40.1% |
|
Sukma |
Chattisgarh |
1.4% |
90.4% |
0.9% |
28.8% |
48.9% |
27.7% |
|
Surajpur |
Chattisgarh |
3.9% |
60.2% |
1.6% |
36.9% |
55.4% |
32.0% |
|
Average of Chattisgarh |
3.7% |
69.5% |
1.4% |
39.1% |
52.8% |
33.8% |
|
|
Alirajpur |
Madhya Pradesh |
3.7% |
89.0% |
2.4% |
45.6% |
49.8% |
35.5% |
|
Anuppur |
Madhya Pradesh |
9.9% |
47.9% |
2.9% |
35.5% |
48.6% |
33.6% |
|
Barwani |
Madhya Pradesh |
6.3% |
69.4% |
4.2% |
46.5% |
55.0% |
44.6% |
|
Dhar |
Madhya Pradesh |
6.7% |
55.9% |
5.3% |
43.6% |
50.1% |
36.1% |
|
Dindori |
Madhya Pradesh |
5.6% |
64.7% |
1.0% |
41.5% |
39.4% |
28.3% |
|
Jhabua |
Madhya Pradesh |
1.7% |
87.0% |
1.5% |
35.3% |
47.2% |
38.1% |
|
Mandla |
Madhya Pradesh |
4.6% |
57.9% |
1.6% |
40.8% |
49.6% |
36.3% |
|
Umaria |
Madhya Pradesh |
9.0% |
46.6% |
2.5% |
45.1% |
62.1% |
42.0% |
|
Average of MadhyaPradesh |
5.9% |
64.8% |
2.7% |
41.7% |
50.2% |
36.8% |
|
|
Udaipur |
Rajasthan |
6.1% |
49.7% |
3.4% |
44.8% |
56.3% |
43.6% |
|
Banswara |
Rajasthan |
4.5% |
76.4% |
2.7% |
47.6% |
49.4% |
39.7% |
|
Dausa |
Rajasthan |
21.7% |
26.5% |
2.8% |
34.1% |
29.2% |
34.5% |
|
Dungarpur |
Rajasthan |
3.8% |
70.8% |
2.1% |
45.3% |
48.3% |
31.7% |
|
Sirohi |
Rajasthan |
19.5% |
28.2% |
2.9% |
51.1% |
53.2% |
46.1% |
|
Pratapgarh |
Rajasthan |
7.0% |
63.4% |
3.0% |
43.8% |
60.5% |
46.4% |
|
Average of Rajasthan |
10.4% |
52.5% |
2.8% |
44.4% |
49.5% |
40.4% |
|
|
Average of Rajasthan, MadhyaPradesh and Chattisgarh |
6.7% |
62.3% |
2.3% |
41.7% |
50.8% |
37.0% |
|
So in these ST dominated districts (average ST population 62.3%) of these 3 States, the vote% of BJP reduced to 37.0% in 2018 assembly election as compared to 41.7% in 2013 assembly elections. So there is a drop of 4.8% in between two assembly elections.
When it is compared with 2014 Parliament election then the drop is 13.8%.
This indicates ST votes are drifting away from BJP as compared to 2013 Assembly or 2014 Parliament election.
So in 2019 Parliament election, we will probably see a drop of BJP vote share as compared to 2019 in these SC and ST dominated districts.
This article is written by Partha Pratim Das.
Source of the data is www.chanakyya.com